Hiring, measured. Not guessed.

Every team has a gut feeling about where hiring slows down. Reena reads every stage of your live funnel and turns that feeling into a number: where candidates stall, how fast you are moving, and whether last quarter's fix actually worked.

reena · analytics
Applications
1,284
+18% vs prior
Time to hire
18d
6d faster
Offers accepted
72%
+9 pts
Candidates hired · by weekhover a bar
35465879
The bottleneck

Where is hiring actually stalling?

Most teams sense the funnel is leaking somewhere, but not where. Reena maps every candidate to a stage and reads the drop between each one, so the biggest loss is a fact on the screen, not an argument in a meeting.

Read continuously

Every application is placed in a stage the moment it lands, so the funnel is always current, not a month behind.

The drop is named

Reena flags the single stage losing the most candidates and shows how it compares to the rest of the funnel.

funnel · this quarter1,284 applied
Applied 1,284
Screened −67%420
Interview −81% · biggest drop78
Panel −60%31
Offer −65%11

Not just the number. The reason.

A dashboard shows you the drop. Reena tells you what is behind it. It reads the stage in context, checks it against the rest of the funnel and the last few months, and hands you a plain-language read with the evidence attached.

It finds the worst drop for you.No pivot tables. Reena surfaces the stage losing the most candidates and ranks the rest.
It shows the evidence.Time in stage, decline patterns and interviewer load: the signals that explain why a stage stalls.
You decide what to change.Reena suggests; your team acts. Every read links back to the candidates behind it.
Reenareading · funnel diagnosis
Live

Interview is your bottleneck. 78 of 420 screened candidates reach interview, an 81% drop. It is the steepest stage in your funnel and 22 points worse than last quarter.

The likely cause: candidates wait 9 days on average for a first-round slot, and 3 in 5 declines happen inside that window.

What Reena checked
  • Avg wait to first round 9 days
  • Declined while waiting 61%
  • Interviewer capacity 2 people · 40 slots
  • vs last quarter −22 pts
velocity · this quarter vs last
Time to hireMedian days from application to signed offer24 → 18 d
Time to screenApplication to first shortlist decision3 d → 4 h
Offer acceptShare of offers accepted first time63% → 72%
Time to startAccepted offer to first daysteady

How fast are we hiring, and is it improving?

A single average hides the story. Reena tracks each velocity measure, time to hire, offer to hire and time to start, against the period before it, so you can see whether a change actually moved the number or whether it was noise.

Application volume is trended alongside, bucketed automatically into daily, weekly or monthly depending on the range, so a campaign that spiked applications or a source that dried up shows as a shape rather than a surprise.

Are interviews and scorecards reliable?

Reliable hiring needs reliable interviews, so Reena measures the process, not just the outcome: interviews scheduled, completed and cancelled, the no-show rate, and the average lag from invitation to interview, so friction is visible before an offer is ever made.

Per-evaluator profiles.Count, average score, deviation, approval rate and turnaround, so a lenient or strict outlier is visible.
Inter-rater reliability.Whether two interviewers scoring the same candidate tend to agree, and which criteria actually differentiate.
Evaluation coverage.The share of interviews that got a scorecard at all, so decisions rest on evidence rather than memory.
reena · scorecardEvaluator view
Technical depth
Communication
Domain fit
Weighted total4.2/5
Proof

What the numbers look like on Reena.

Measured on client hiring, not benchmarks.

10,000+
Applicants tracked per programme intake
Misk Foundation · Saudi Arabia
3–6 days
Time to hire, down from around two weeks
Measured on-platform
30–40%
Higher candidate engagement
CNTXT AI · UAE

Just ask a question about your hiring data.

No report to build, no filter to configure. Reena is rolling out a plain-language way to ask questions of your own hiring data, so a query like which stage lost us the most candidates returns an answer grounded in your live pipeline.

Plain language in, real numbers out."Which stage lost us the most candidates last quarter?" returns an answer from your live data.
Always the same source.Every answer reads the same record your reports use, read-only and scoped to your organisation. No second version of the truth.
Ask Reena · rolling out
Which stage lost us the most candidates last quarter?
Reenafrom your data

Interview. You lost 342 candidates between screening and interview, more than any other stage, mostly to slow scheduling.

Lost 342Avg wait 9dvs Q1 +22%

The picture reaches you, not the other way round.

Most managers do not want another tab to check. Reena brings the numbers to where the work already happens.

01 · Daily digest

A short read each morning

One email per pipeline you follow: new applications, stage movements, interviews held, no-shows and disqualifications. Live today.

02 · You choose what is in it

Per programme, on your clock

Opt in per programme, pick the send hour and timezone, and toggle whether new applications and movements are included.

03 · In your inbox

No login needed

The summary lands where you already work, and the full picture is one click away when you want the detail behind a number.

Frequently Asked Questions

No. The funnel, time-in-stage and velocity analytics are live the moment your pipeline runs on Reena. There is nothing to configure before you see the numbers, and nothing to maintain afterwards. Set an optional target for each stage and the bottleneck flags start working immediately.
From your own pipeline. Every stage move, decline, score and offer is written to one record, and analytics reads that record, so reports and the answers Reena gives draw on the same source. There is no second version of the truth and no monthly export to reconcile.
Start with the metrics that reveal flow and speed: applications by stage, stage-to-stage conversion, time in each stage, and time to hire from application to offer. Add interview reliability, no-show rate and per-stage attrition once the basics are steady. Reena reports all of these from your pipeline, without extra admin.
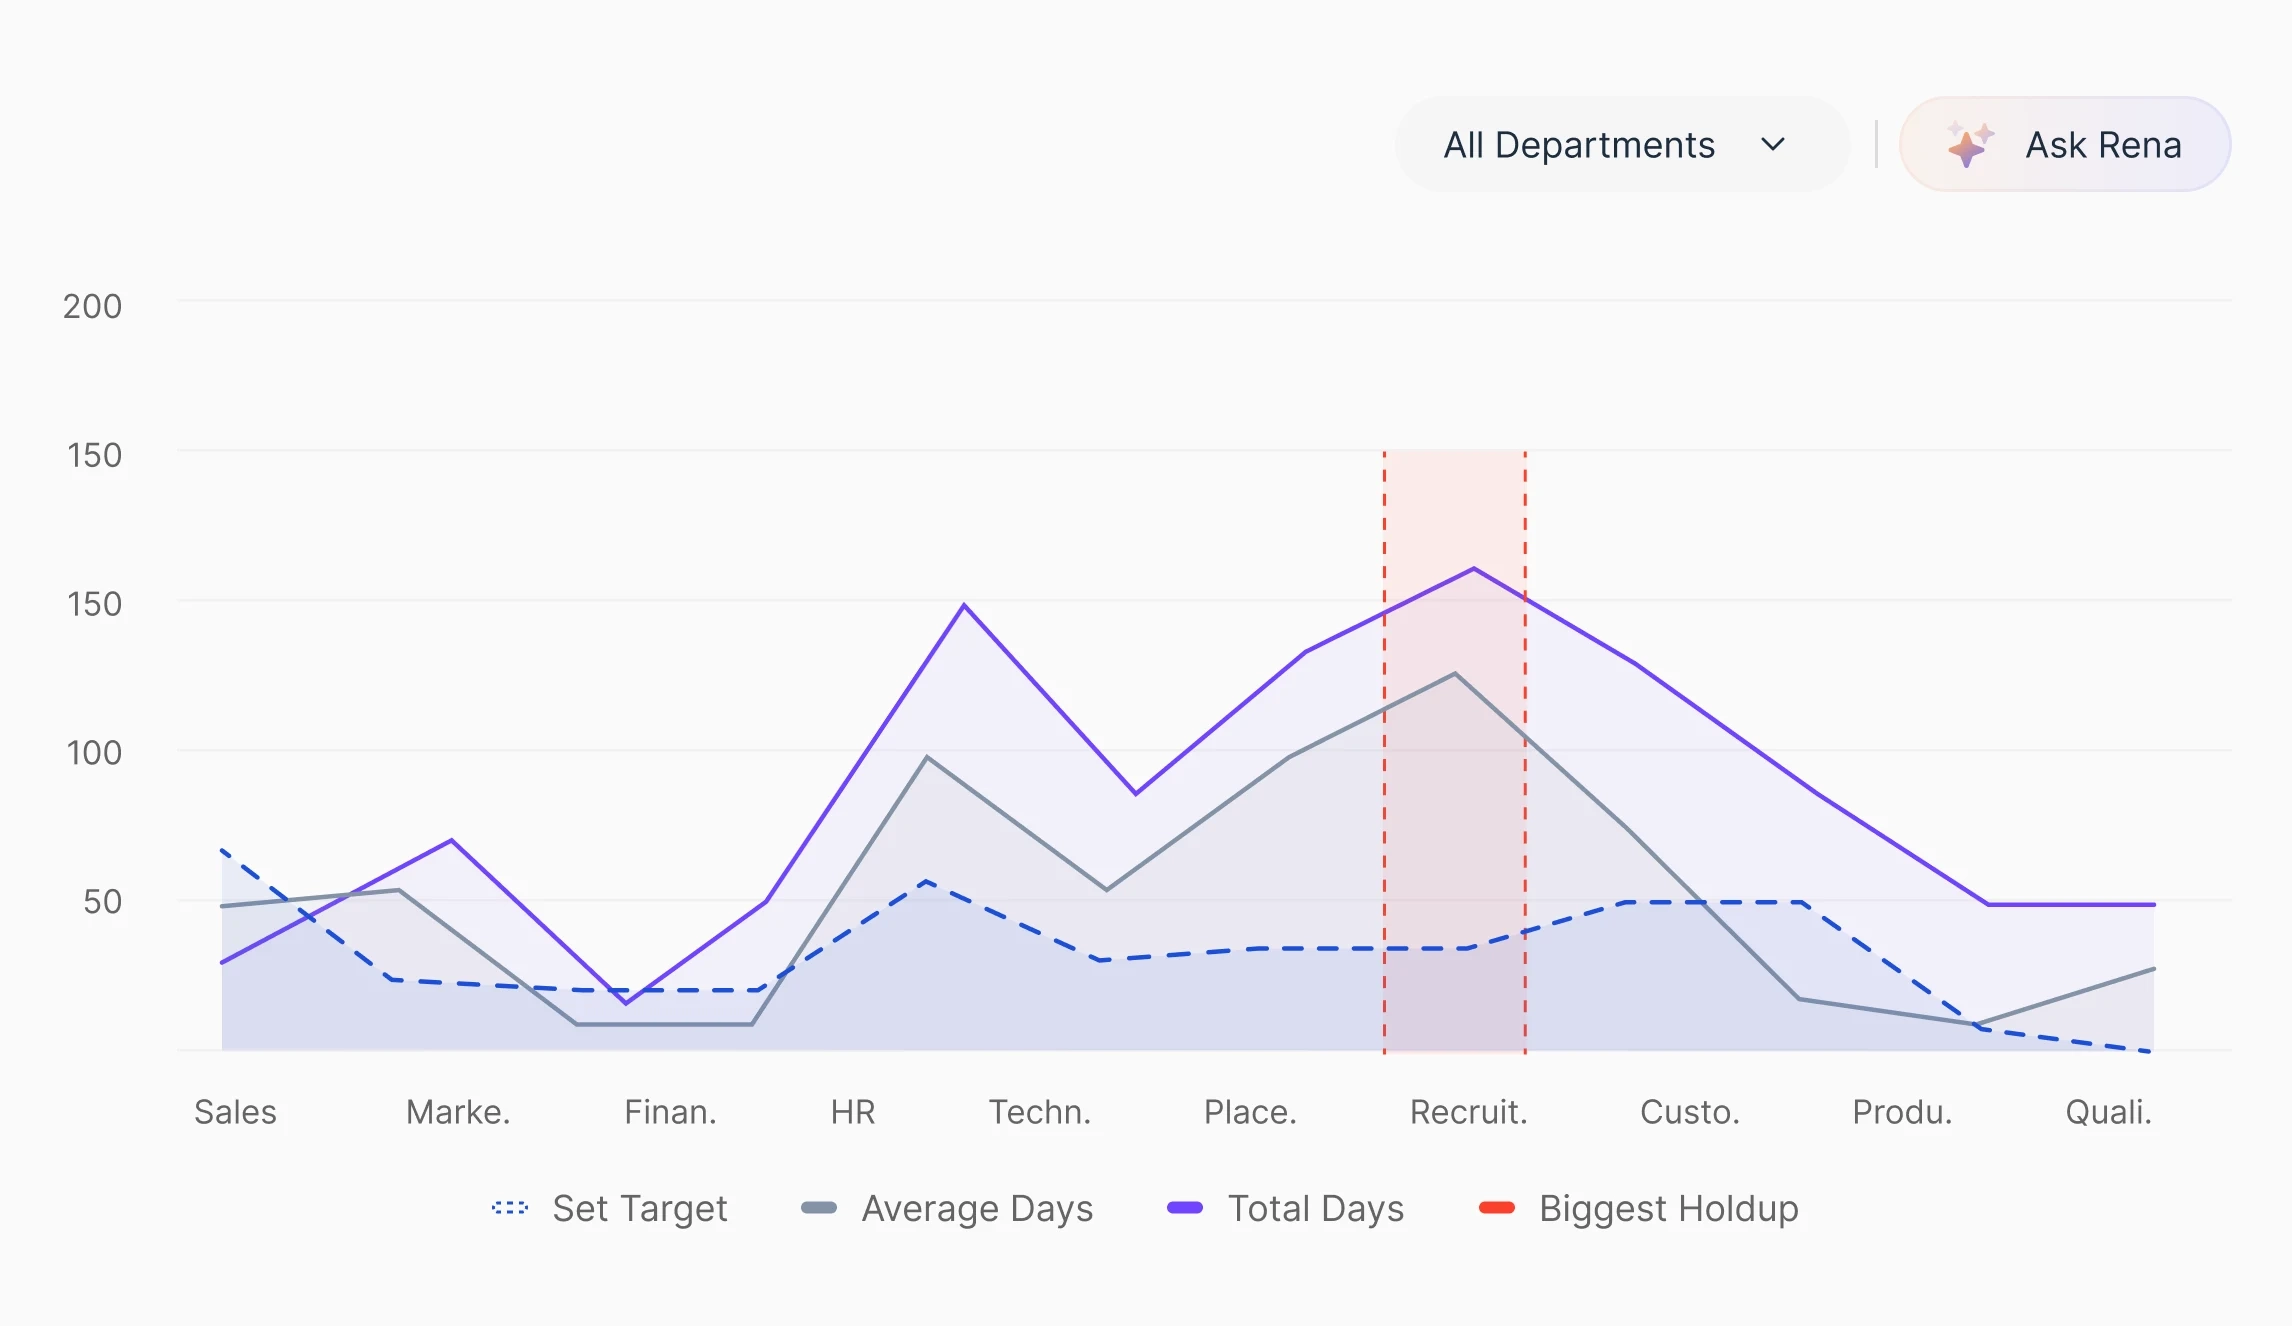
Look at two numbers side by side: conversion between stages and time spent in each stage. A stage that holds candidates far longer than the others, or where most drop off, is your bottleneck. Reena flags these automatically, comparing median and P90 days against the target you set for each stage.
Reena measures the measuring: per-evaluator averages and approval rates, whether two interviewers scoring the same candidate agree, which criteria actually differentiate applicants, and how many interviews received a scorecard at all. Where the evidence is thin, that is surfaced rather than hidden.
Yes. A daily digest email summarises what changed in each pipeline you follow: new applications, stage movements, interviews held, no-shows and disqualifications. It is opt-in per programme, with a send hour and timezone you choose, so the picture reaches you before you open the platform.

Stop guessing where hiring stalls.
Start measuring it.